Tag: line charts
-
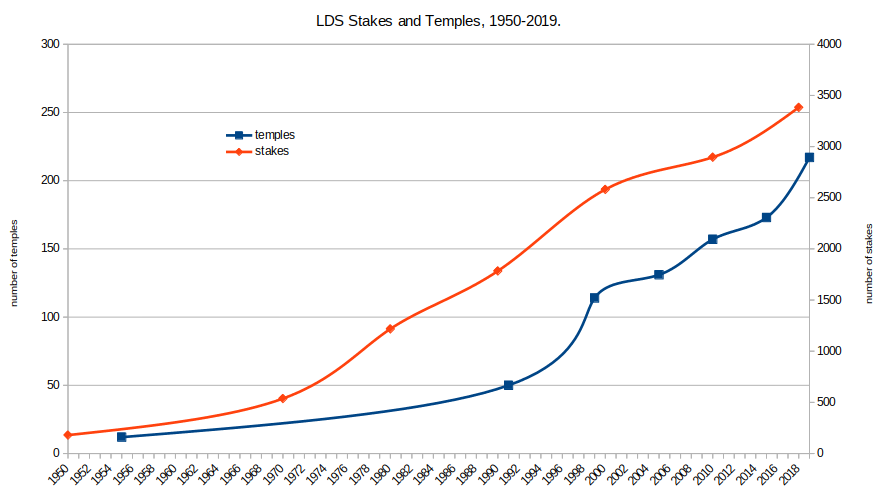
LibreOffice Calc: Graphs with Two y-axes with Different Scales
While a bit technical, it’s occasionally useful to plot multiple data series that have very different scales in the same chart. Let me give an example to illustrate. Let’s say I want to see whether the number of Mormon temples being built aligns with the number of Mormon stakes (akin to a Catholic diocese) that…
-
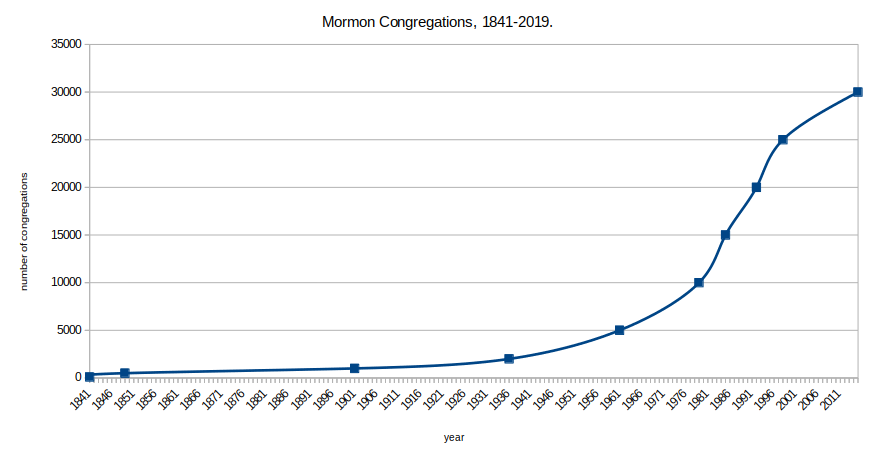
LibreOffice Calc: Interpolating Missing Values in Graphs
Here’s my situation. I have some data over time but I’m missing values in specific years. I want to graph that data but would rather not have to estimate all of the missing values. It turns out, LibreOffice Calc can do that for you in your chart. Here’s how… Imagine I’m plotting the number of…