Tag: LibreOffice Calc
-
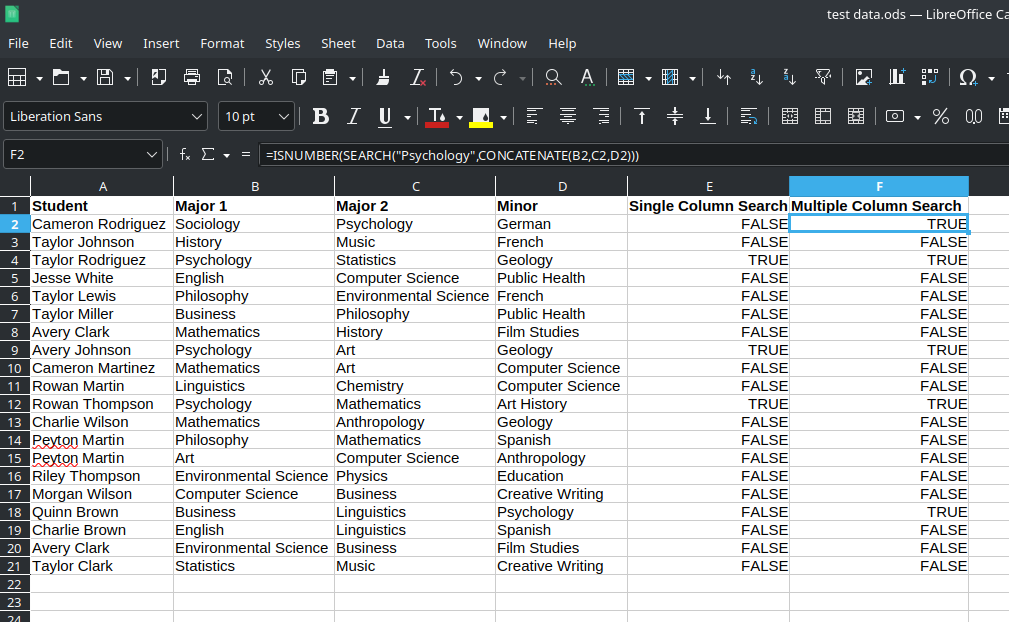
LibreOffice Calc – Search for Specific Text Across Columns
I have a task I am asked to do fairly regularly that involves searching through a large spreadsheet (around 4,000 rows with about a dozen columns) looking for very specific text. There are, of course, various ways I could accomplish this. But I finally found a solution that speeds this up and want to document…
-
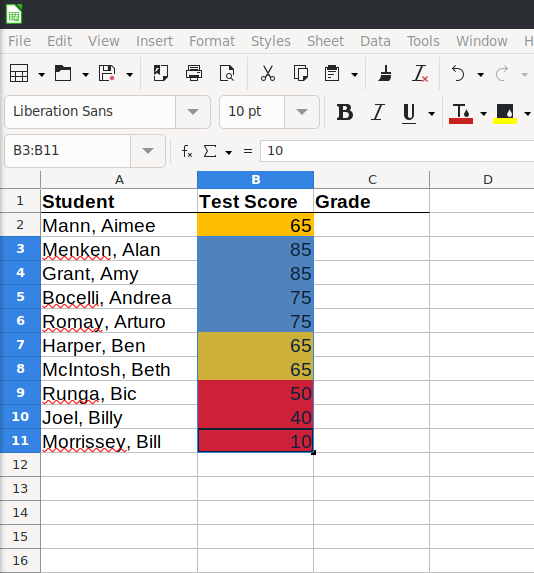
LibreOffice Calc – Conditional Formatting
I haven’t used this feature of spreadsheet software as much as I probably should, but I have a spreadsheet I have been working with a lot lately and conditional formatting has been key to helping me orient myself in the spreadsheet. However, in the process, I realized that I am really a noob when it…
-
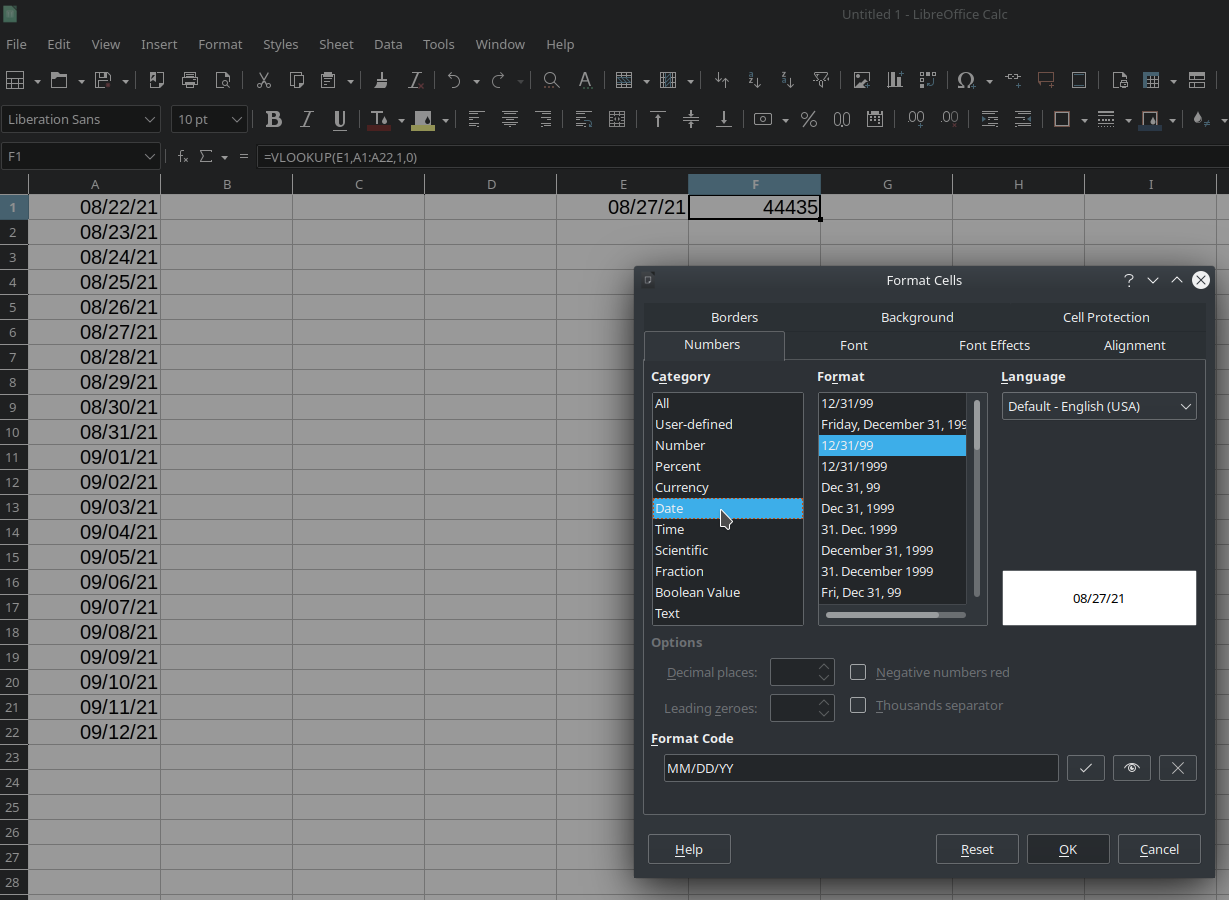
LibreOffice Calc – VLookup with dates
In a different post on this blog, I showed how to use Vlookup to match lists. Someone commented on that post and indicated that it didn’t work with dates. It turns out, it does, but… There is a slight tweak required to make it work. So, if you want to learn how to use VLookup,…
-
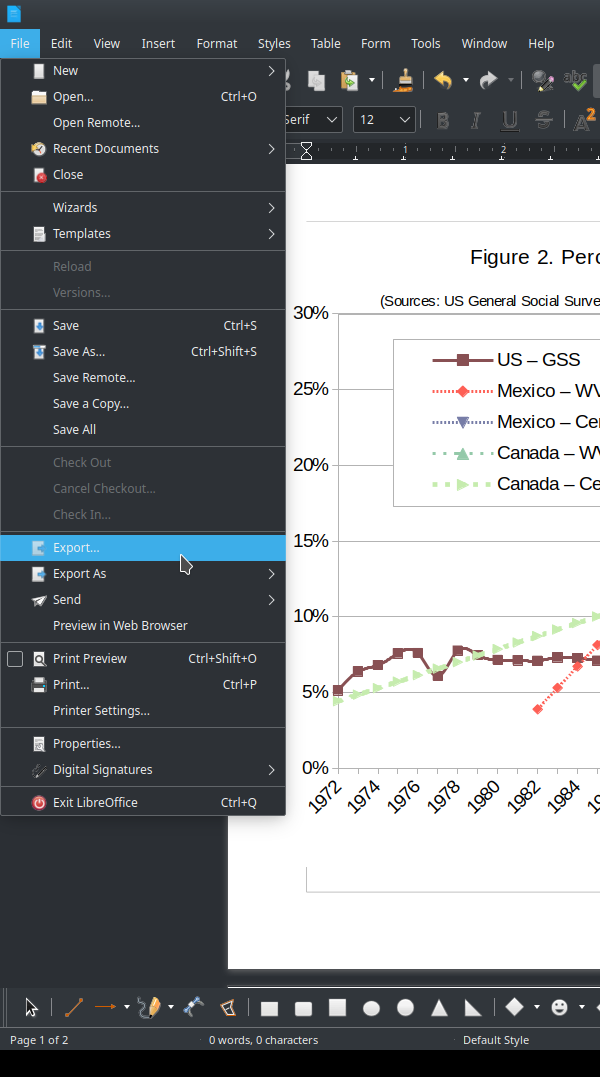
LibreOffice – exporting high-resolution TIFF/TIF files
As a scholar who regularly publishes work with charts and graphs, I’m often confronted with varied requirements from publishers for the format in which they want the charts and graphs. Most often, the format is as a TIFF/TIF file, typically with at least 300 dpi and somewhere around 1500×1500 pixels. I make most of my…
-
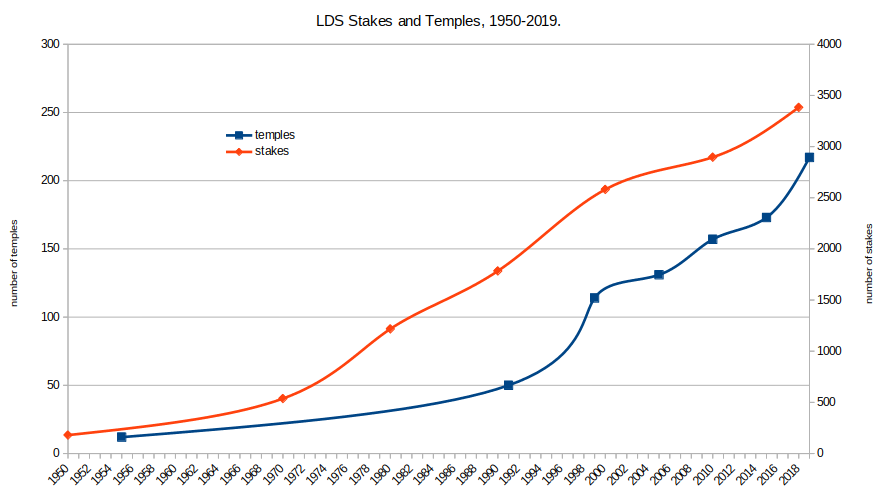
LibreOffice Calc: Graphs with Two y-axes with Different Scales
While a bit technical, it’s occasionally useful to plot multiple data series that have very different scales in the same chart. Let me give an example to illustrate. Let’s say I want to see whether the number of Mormon temples being built aligns with the number of Mormon stakes (akin to a Catholic diocese) that…
-
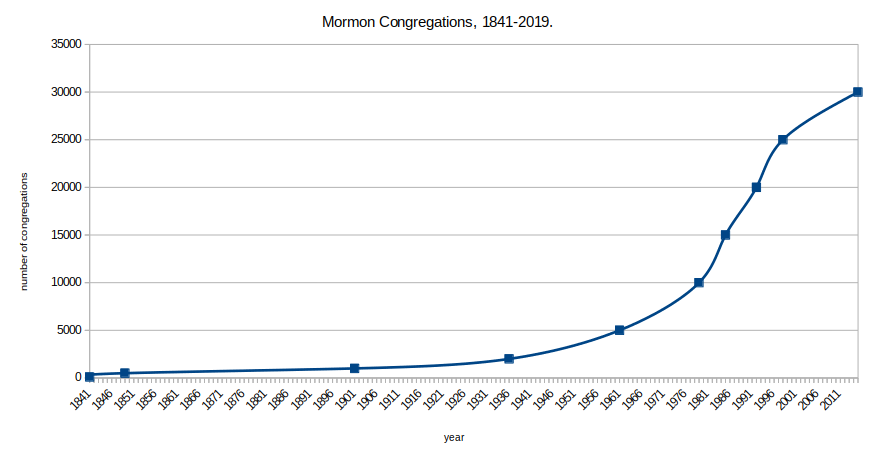
LibreOffice Calc: Interpolating Missing Values in Graphs
Here’s my situation. I have some data over time but I’m missing values in specific years. I want to graph that data but would rather not have to estimate all of the missing values. It turns out, LibreOffice Calc can do that for you in your chart. Here’s how… Imagine I’m plotting the number of…
-
LibreOffice Calc – Creating Charts with Conditional Formatting
I was working on creating a chart in LibreOffice Calc that was kind of weird. Basically, I wanted to show change over time in a dichotomous variable (e.g., political party affiliation in the US – Democrat or Republican). I could, theoretically, make a chart where presence is indicated by “1” and absence is indicated by…
-
LibreOffice Calc – Comparing and Aligning Two Lists Using VLOOKUP
One of the tasks I have to do regularly as part of my job is to compare two lists to see which items are missing on one list but not the other. I have been doing this by hand but figured there had to be a way to do this in Excel. I finally figured…
-
LibreOffice Calc – splitting contents of cells into multiple columns (e.g., splitting commas)
I periodically have to take a column of text in LibreOffice calc that has names like this “Lastname, Firstname” and split them into two columns. I figure it out every time, but then I forget how I did. So, here’s a quick tutorial on how this is done. Open your spreadsheet with the cells that need…