As a scholar who regularly publishes work with charts and graphs, I’m often confronted with varied requirements from publishers for the format in which they want the charts and graphs. Most often, the format is as a TIFF/TIF file, typically with at least 300 dpi and somewhere around 1500×1500 pixels. I make most of my charts in LibreOffice Calc, though occasionally I make some in R as well.
I have recently been editing several volumes in which I had to manage the charts and graphs of other scholars as well. As the editor, I had to make sure the final images met the criteria detailed above. Since scholars often make charts and graphs in Word, it took a little finagling to come up with a quick and easy way to export the images in the format needed by the publisher. Since I did finally figure this out, I figured I’d post it here so I remember how to do this in the future. Luckily, LibreOffice works extremely well with these formats (for the most part), which makes this quite easy.
LibreOffice Calc
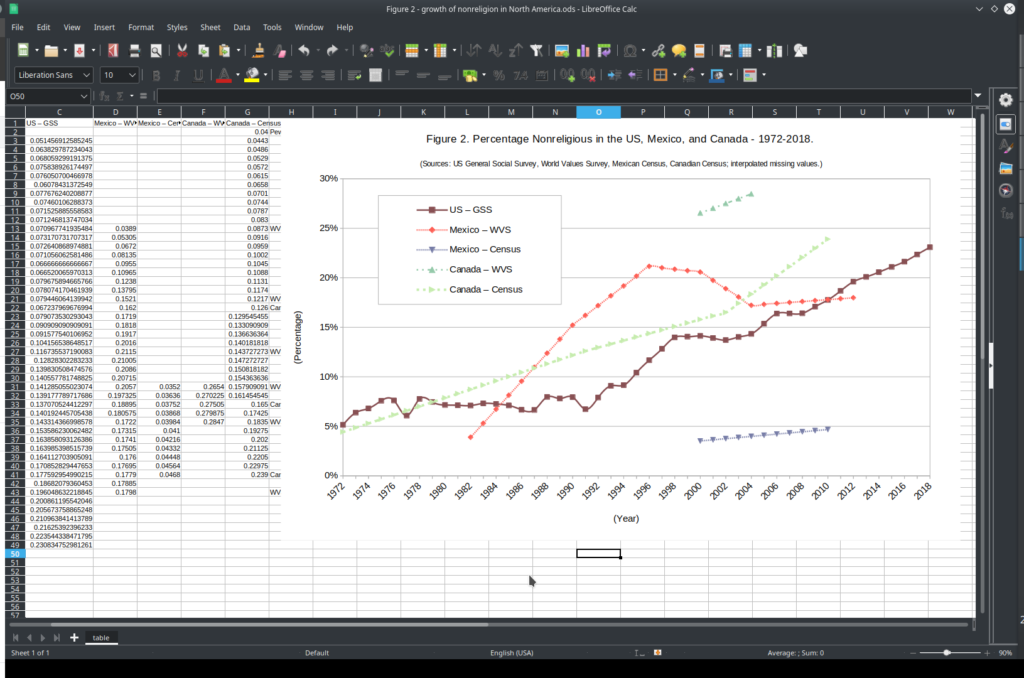
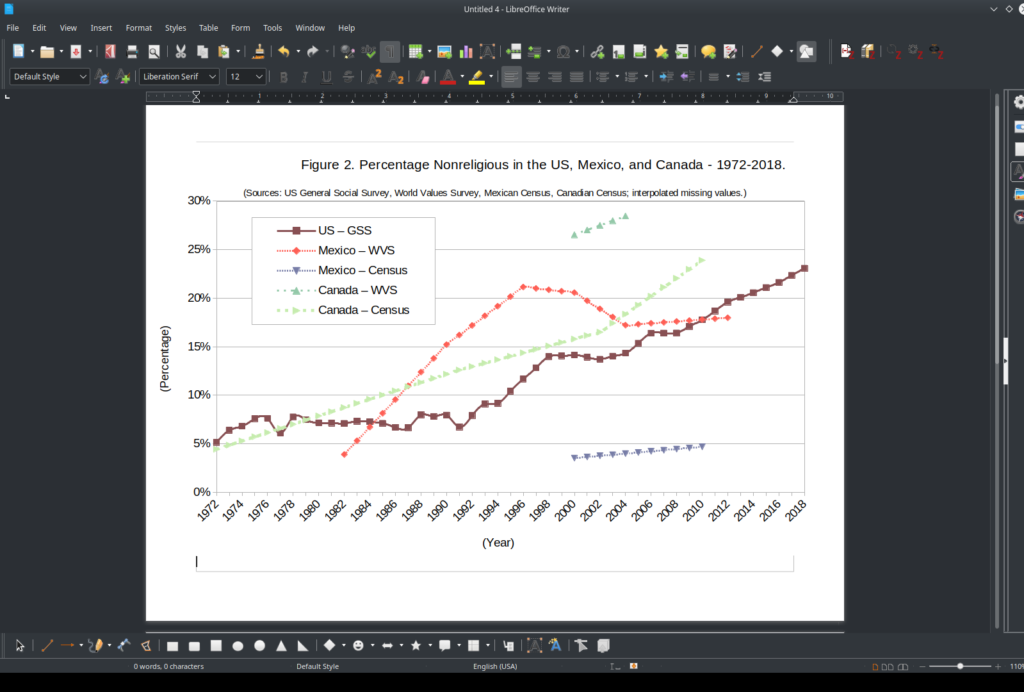
Assuming you have created your chart/graph in LibreOffice Calc, exporting it into a TIF format should be fairly easy, though it requires an unfortunate extra step. Here’s a chart I created in LibreOffice Calc:

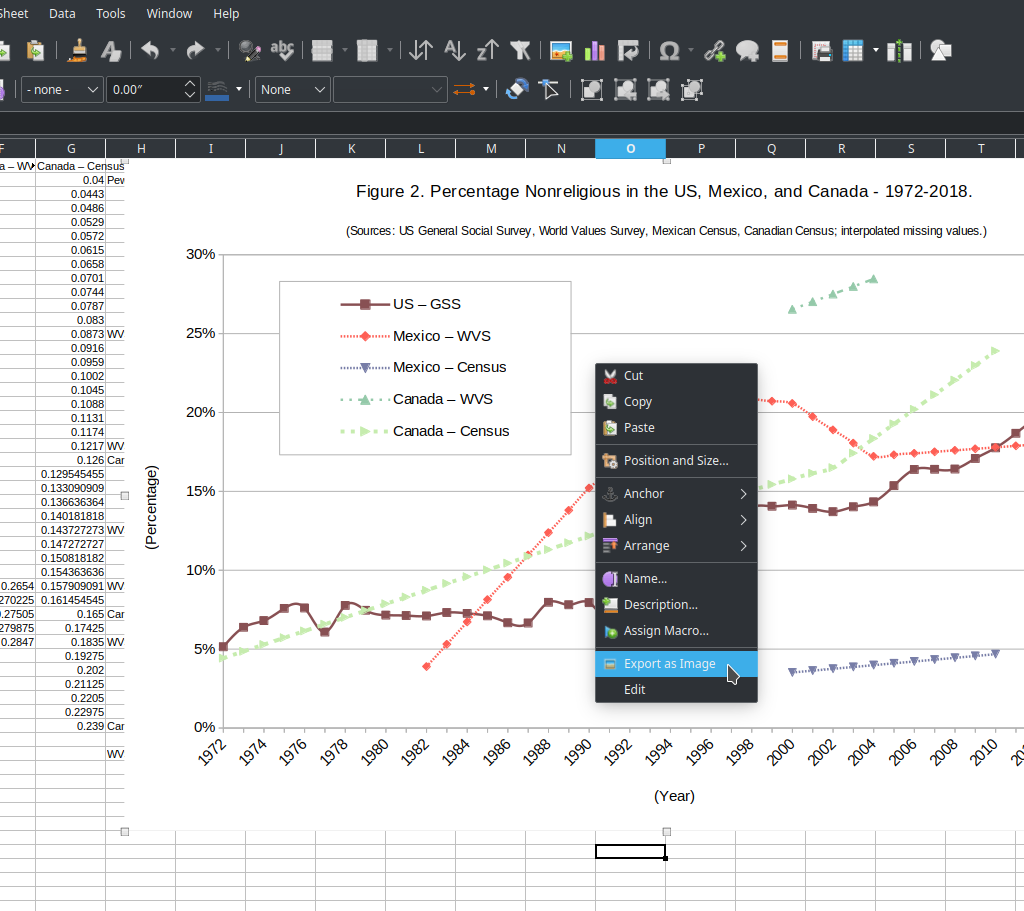
The LibreOffice programmers make it so you can just right-click on the graph and select “Export as Image.”

When you do this, you’ll get this pop-up window asking where you want to save the image and, more importantly, the format:

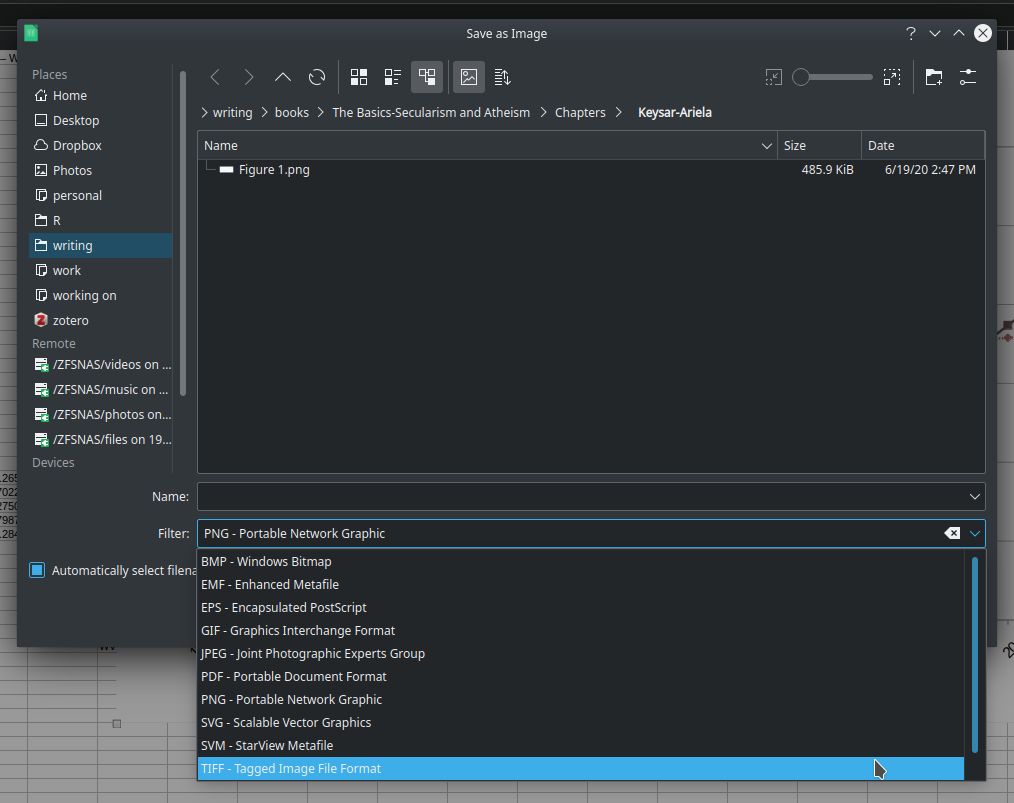
Here’s where you get a problem. If you select TIFF, you’ll get a .tif file, but the resolution will be basically the same as what you see on your screen, like this:

Ideally, LibreOffice would ask you what DPI and resolution you want once you select the TIFF format and would then export the chart in that resolution and you’d be done in one simple step. Alas, that’s not an option when you export from LibreOffice Calc.
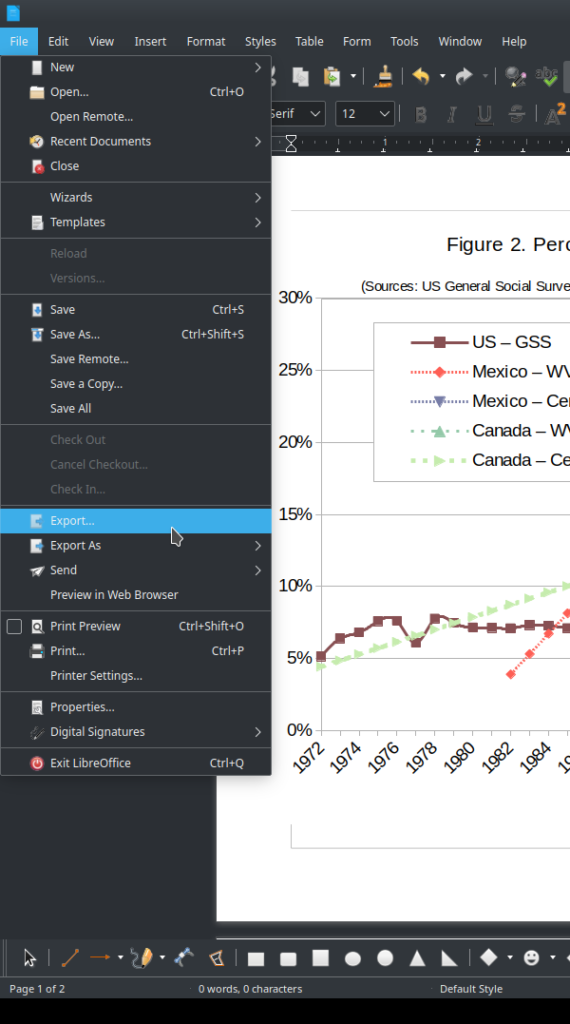
What you can do instead is copy your chart, open an empty LibreOffice Writer document, and paste it into the document, like this:

Then, go up to File -> Export, like this:

You’ll get the same prompt as before asking what you want to name the file and format. Name the file and select PNG format then click “Save.” What you’re looking for is the window that pops up next:

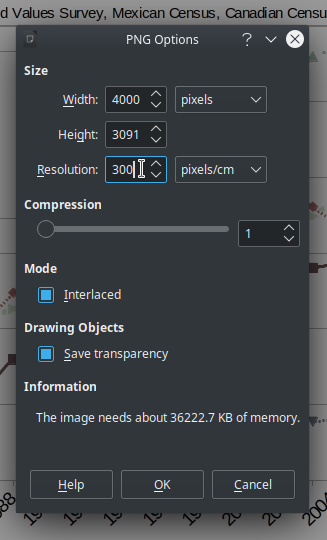
In this window, you can change the DPI to 300 (do this first) and then change the width and height (they are typically linked, so, if you change one, the other automatically changes). When you’re done, click “OK.” The file you’ll get will be 300 DPI and whatever pixels you chose:

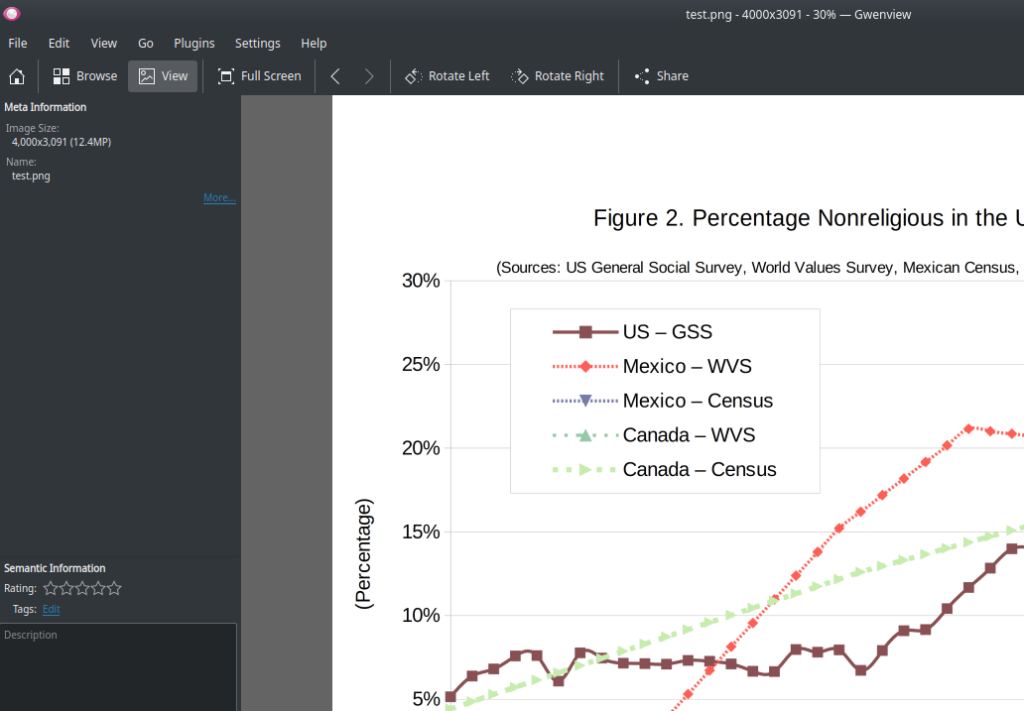
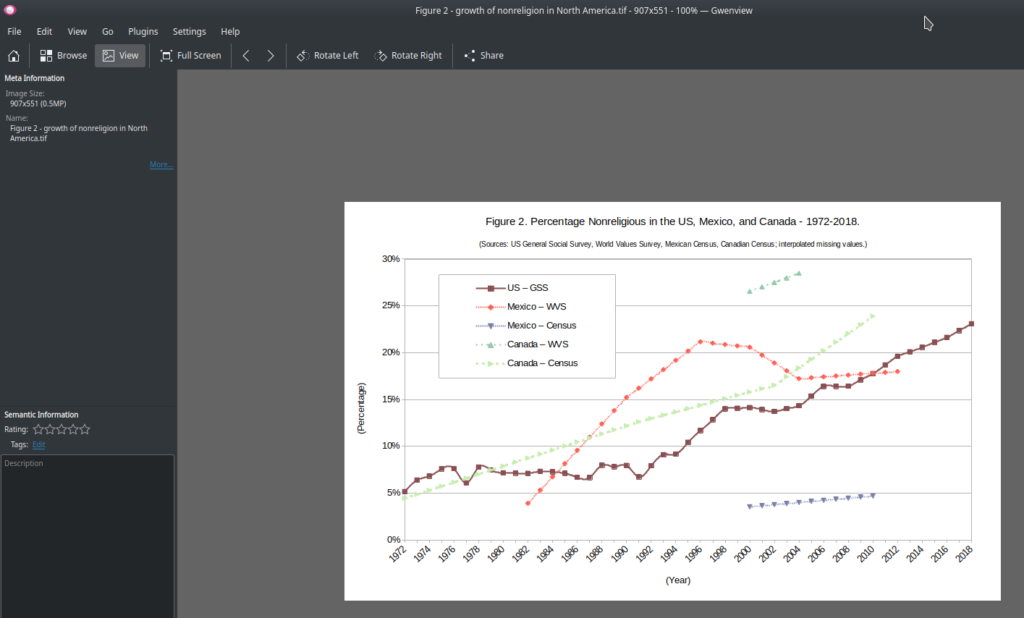
Now, open that file with any image editing software (I’m using Gwenview on KDE for this example) and simply select File->Save As:

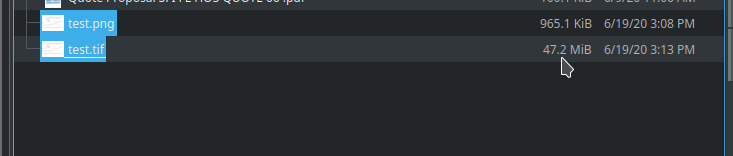
Now select the TIFF format. Once you save it, you’ll have a TIFF file with the proper DPI and resolution per the publisher’s instructions. The resulting TIFF file will be huge, but it will meet the criteria of the publisher:

NOTE:
The other way to do this is to copy your chart into a LibreOffice Draw file that has been modified with a huge area (e.g., 4000×4000 pixels). You can then expand your chart to file the area in the LibreOffice Draw document and then export the image. However, depending on the original format of your chart/graph, you may have to resize the text if you do this, which is a pain. However, this will give you a much larger image file. But the approach above is much easier.
The tutorial above used LibreOffice 6.4.4.2.
![]()
